CHE 318 Lecture 28
Humidification Process II
2026-03-18
Learning outcomes
After this lecture, you will be able to:
- Recall humidification and cooling paths on the psychrometric chart.
- Describe the origin of wet-bulb temperature and latent-heat effects during evaporation.
- Analyze adiabatic saturation using coupled heat and mass balances.
- Apply the psychrometric chart to obtain humidity-related properties.
Cheatsheet for humidification process
![]()
Charts distributed in class.
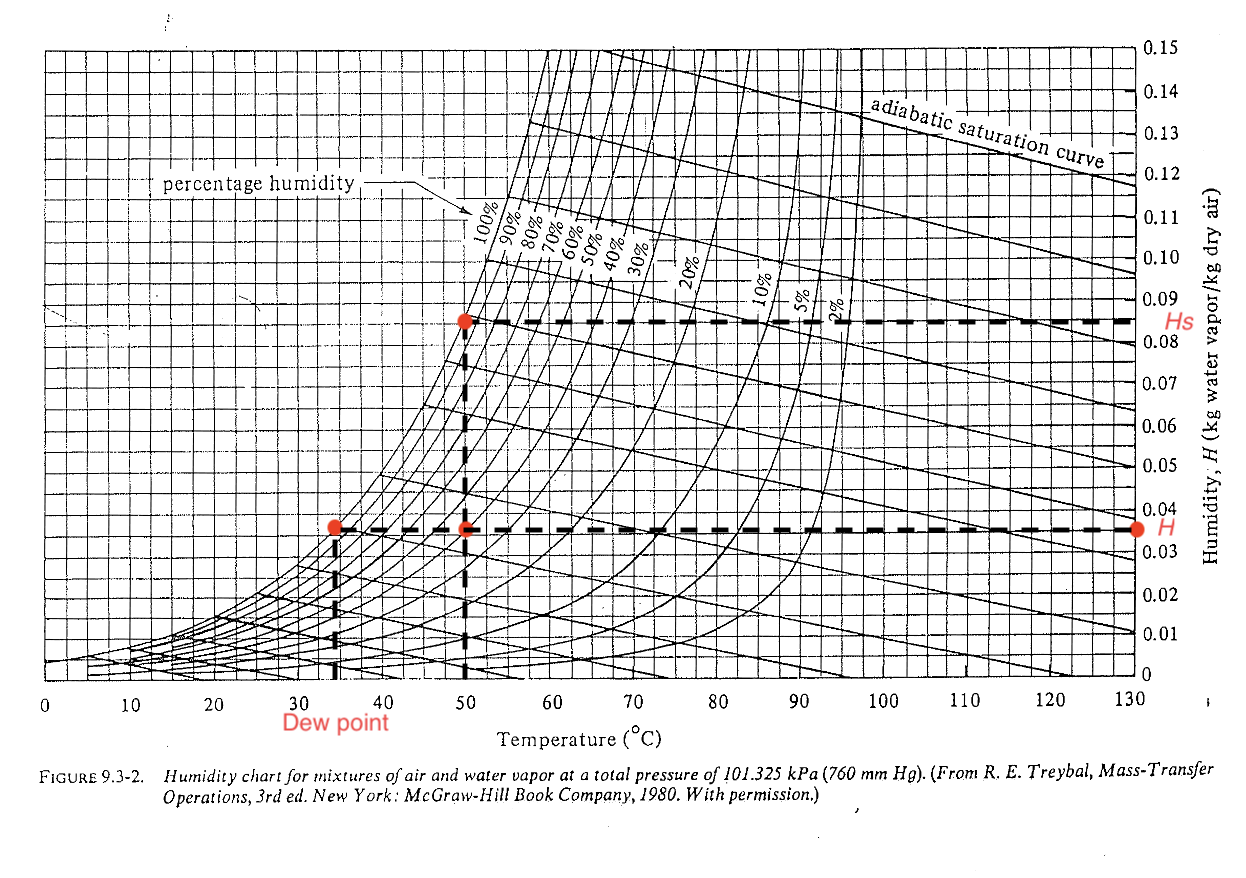
Reading the humidity / psychrometric chart (level 1)
Find where \(H\), \(H_p\), dew point \(T_{\text{dew}}\) are?
![]()
Example 2: humidifier design
A living room of 60 m\(^2\) at 22 \(^\circ\)C has a relative humidity of 20% due to continuous heating. You and your roommate wish to purchase a humidifier that can humidify the living room up to 45% relative humidity. Assume the floor-ceiling distance is 3 m, calculate the weight of water needed to humidify the whole room. Can you use the humidity chart to estimate?
Mythbusting time (1)
My weather app shows that outside is \(-12\ ^\circ\)C and R.H. is 74%, where the dew point is \(-16\ ^\circ\)C. What does all that mean?
A useful note is that the lower dew point is compared with current temperature, the drier air appears to be
Mythbusting time (2)
In the previous scenario \(-12\ ^\circ\)C and R.H. is 74%, when I open the door, my humidity in home immediately drops! Why?
- The calculated \(H_R\) at room temperature is only 6.7% if fully filled with outside air.
\(H_R\) (or R.H.) only measures up at current temperature. When moving water content at different \(T\), \(H_R\) will change.
- cold air 👉 appears to be dry at high T
- warm air 👉 appears to be humid at low T
Mythbusting time (3)
Why does “humid hot” environment feels much hotter than “dry hot” environment, even if the apparent \(T\) is the same?
- Calculate the enthalpy of air-water mixture, \(H_y\) significantly increases when relative humidity is high!
- Human body relies on cooling to survive. At high \(T\) high \(H_R\), both driving forces for evaporation are reduced:
- \(T_{\text{body}} - T_{\text{env}}\) becomes small 👉 bad dissipation
- \(p_{A, \text{body}} - p_{A, \text{env}}\) becomes small 👉 evaporation suppressed
The sensible specific heat for air-water mixture does not change significantly, even if water vapour’s heat capacity is higher. (absolute \(H\) is always 0.1 when \(T<50\ ^\circ\)C)
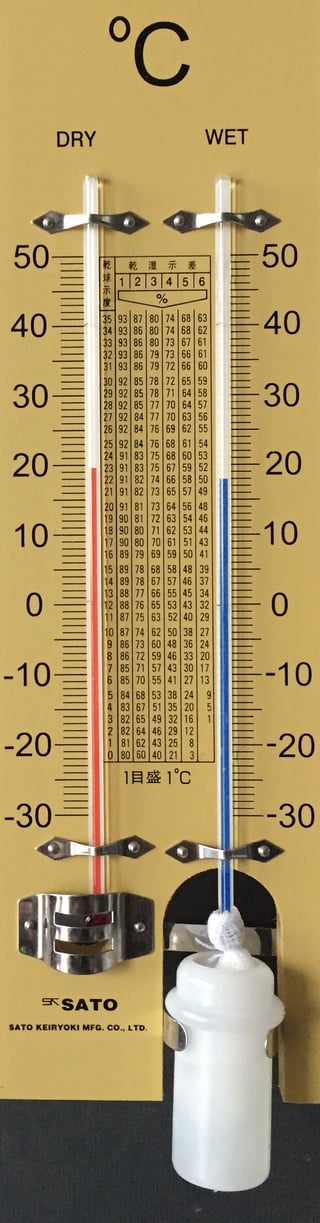
Measuring humidity: the two-bulb hygrometer
Before electronic sensors, humidity was measured using a two-thermometer setup
- One thermometer measures dry-bulb temperature \(T_d\)
- The second thermometer is wrapped with a wet wick and measures wet-bulb temperature \(T_w\) (\(T_w < T_d\))
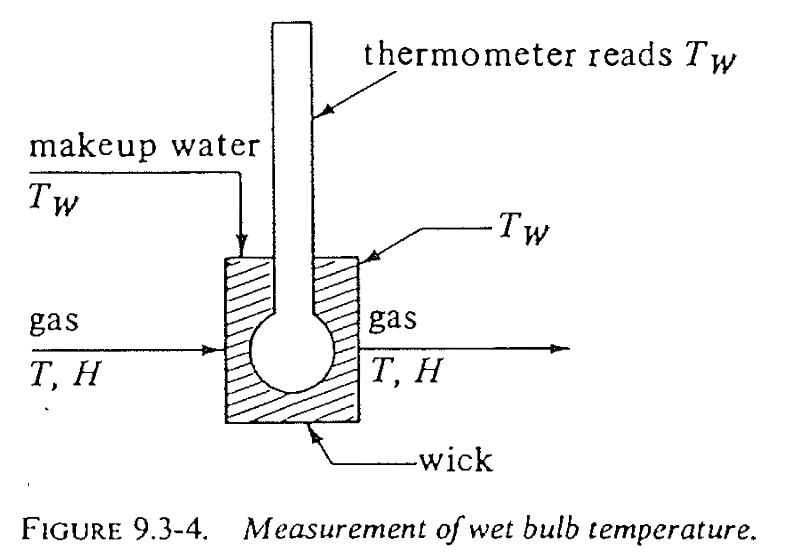
What does the wet bulb tell us?
The wet bulb is a steady state evaporative cooling experiment, which can be generalized for interfacial evaporation problem:
- In and outlet temperatures are the same, while outlet humidity is higher
- Evaporation consumes latent heat
![]()
Concept of wet-bulb temperature
- The wet-bulb temperature \(T_w\) is the temperature reached by a wet surface exposed to air
\[
T_w < T_d
\]
- \(T_d\) = dry-bulb temperature
- \(T_w\) = wet-bulb temperature
- The difference between \(T_w\) and \(T_d\) indicates the inlet air humidity
Moist air enthalpy
From Lecture 27, the specific enthalpy of moist air can be written as
\[\begin{align}
H_{y} = (1.005 + 1.88H)(T - T_0) + 2501.4H
\end{align}\]
- Increase the absolute humidity \(H\) must cause \(H_y\) to increase 👉 gas phase takes heat from liquid.
- Solving the heat + mass balance will give solution to \(T_w\).
Heat balance around the wet bulb
Consider the control volume around the wet bulb. Heat transferred from the air is used to evaporate water, linked by the heat-mass balance (need a bit prerequisite in heat transfer):
\[\begin{align}
q = M_A \lambda_w A N_A
\end{align}\]
- \(m_A\): molecular weight of water
- \(\lambda_w\): latent heat of vaporization at \(T_w\) (44045 kJ/kg mol at 1 atm)
- \(A\): area of the wetted surface
- \(N_A\): molar flux of evaporating water
R.H.S.: mass transfer at the interface
The evaporation rate can be written as
\[\begin{align}
N_A = k_y (y_w - y)
\end{align}\]
- \(k_y\): gas-phase mass transfer coefficient (since \(y_{BM} \approx 1\), \(k_y \approx k_y'\))
- \(y_w\): vapor mole fraction at the interface (saturated at \(T_w\))
- \(y\): vapor mole fraction in bulk air
Converting humidity to mole fraction
We can further change \(y\) to the humidity \(H\) for dilute system. Since humidity is define as weight ratio:
\[\begin{align}
H = \frac{\text{kg }H_2O}{\text{kg dry air}}
\end{align}\]
The mole fraction of vapor is
\[\begin{align}
y = \frac{H/M_A}{1/M_B + H/M_A}
\end{align}\]
Since humidity is typically small
\[\begin{align}
y \approx \frac{M_B}{M_A}H
\end{align}\]
L.H.S. heat transfer to the wet surface
The heat flux \(q\) in L.H.S. from the air to the wet surface is
\[\begin{align}
q = h (T - T_w) A
\end{align}\]
where \(h\) is heat transfer coefficient in the Fourier’s law \(q = -h \Delta T\)
Wet-bulb setup: final results
Combining heat transfer (\(q\)) and mass transfer (\(N_A\)) relations gives
\[\begin{align}
\frac{H - H_w}{T - T_w}
=
- \frac{h}{M_B k_y \lambda_w}
\end{align}\]
Note \(\frac{H - H_w}{T - T_w}\) means the slope of a line on the psychrometric chart. The slope is almost identical to adiabatic line!
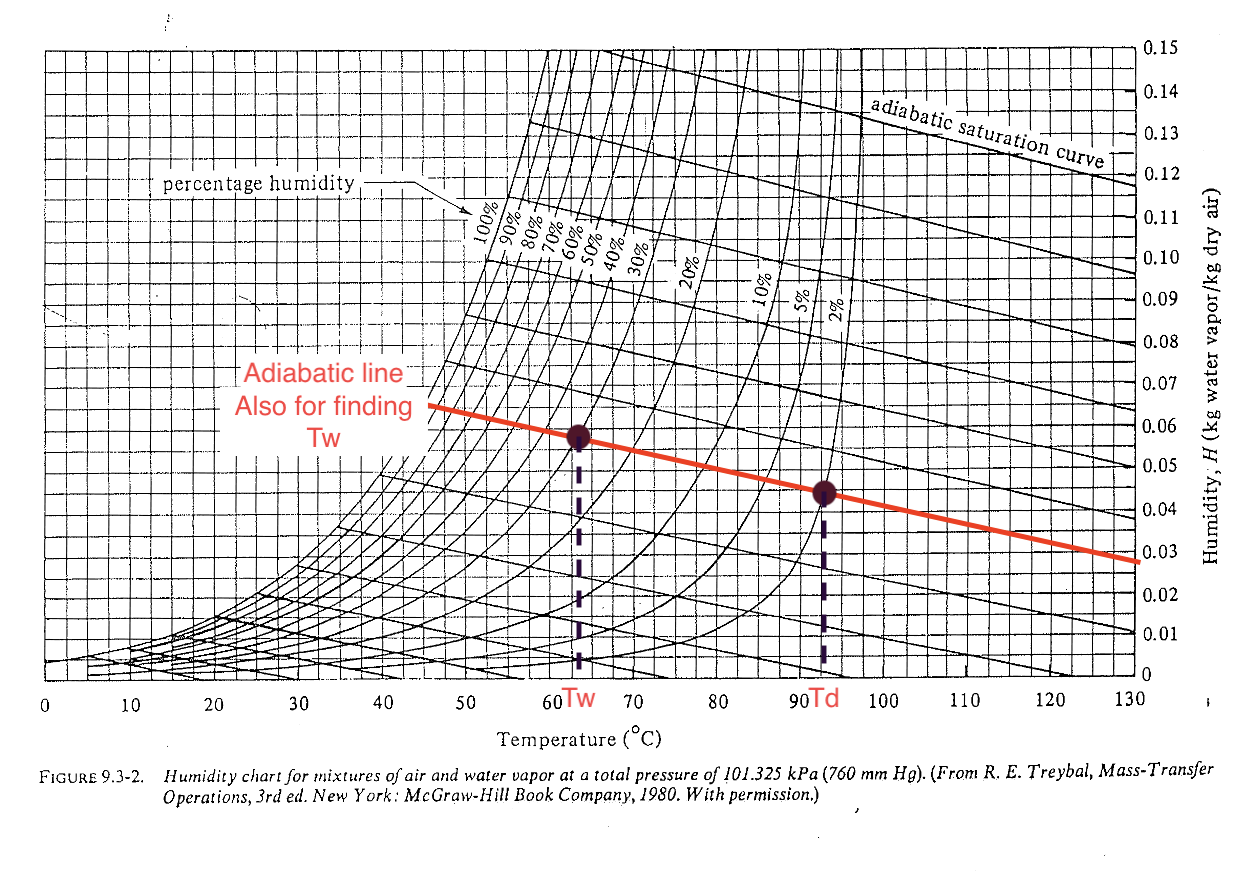
Psychrometric chart: adiabatic line (level 2)
The \((T_d, H_{\text{in}})\) and \((T_w, H_{\text{out}})\) points are along the adiabatic line (no external heat exchange). For water-air system, the adiabatic line and cooling line are very close and often not distinguished.
![]()
Deeper look into the cooling process (1)
What does the adiabatic line tell us? It is basically a process that each point has the same humid enthalpy, and no change of heat to external system:
\[
H = c_s (T - T_0) + H \lambda_0 = \text{[Const]}
\]
- Increase humidity ➡ decrease \(T\)
- Lowest temperature can reach in the system at certain \(H_{\text{out}}\) is \(T_w\)
- Lowest temperature can reach when air is saturated is \(T_s\)
Deeper look into the cooling process (2)
For water-air, one handy property is that
\[
\frac{h}{M_B k_y} \approx 1.005 \approx c_s \qquad \text{[kJ / kg air]}
\]
such relation allows us to use the humidity chart’s adiabatic saturation curve.
Such simplification may not be applicable for other liquid, such as benzene!
What to learn next
The wet-bulb experiment connects heat transfer and mass transfer, and the evaporation rate depends on the vapor pressure driving force.
Next topics we will study:
- Gas-phase mass transfer during evaporation
- Interfacial equilibrium between water and air
- Driving force expressed as \((y_w - y)\) or \((p_{sat} - p_A)\)
Summary
- Reading humidity chart for cooling process
- Wet-bulb temperature and its origin
- Calculation of humidity values from the chart + equation